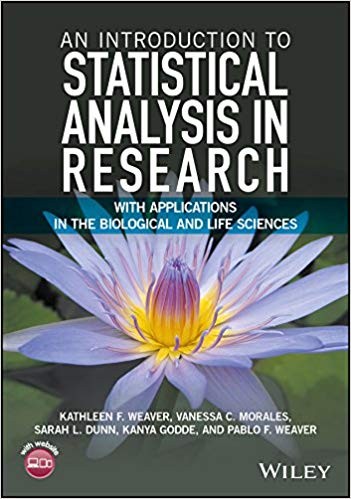
(eBook PDF) An Introduction to Statistical Analysis in Research, Optimized Edition: With Applications in the Biological and Life Sciences
$50.00 Original price was: $50.00.$35.00Current price is: $35.00.
(eBook PDF) An Introduction to Statistical Analysis in Research, Optimized Edition: With Applications in the Biological and Life Sciences – Instant Download
(eBook PDF) An Introduction to Statistical Analysis in Research, Optimized Edition: With Applications in the Biological and Life Sciences – Digital Ebook – Instant Delivery Download
Product details:
Author: KATHLEEN F. WEAVER
An Introduction to Statistical Analysis in Research: With Applications in the Biological and Life Sciences develops a conceptual foundation in statistical analysis while providing readers with opportunities to practice these skills via research-based data sets in biology, kinesiology, and physical anthropology. Readers are provided with a detailed introduction and orientation to statistical analysis as well as practical examples to ensure a thorough understanding of the concepts and methodology. In addition, the book addresses not just the statistical concepts researchers should be familiar with, but also demonstrates their relevance to real-world research questions and how to perform them using easily available software packages including R, SPSS®, Excel®, and Numbers®. Specific emphasis is on the practical application of statistics in the biological and life sciences, while enhancing reader skills in identifying the research questions and testable hypotheses, determining the appropriate experimental methodology and statistical analyses, processing data, and reporting the research outcomes.
Table contents:
1: Experimental Design
1.1 Experimental Design Background
1.2 Sampling Design
1.3 Sample Analysis
1.4 Hypotheses
1.5 Variables
2: Central Tendency and Distribution
2.1 Central Tendency and Other Descriptive Statistics
2.2 Distribution
2.3 Descriptive Statistics in Excel
2.4 Descriptive Statistics in SPSS
2.5 Descriptive Statistics in Numbers
2.6 Descriptive Statistics in R
3: Showing Your Data
3.1 Background on Tables and Graphs
3.2 Tables
3.3 Bar Graphs, Histograms, and Box Plots
3.4 Line Graphs and Scatter Plots
3.5 Pie Charts
4: Parametric versus Nonparametric Tests
4.1 Overview
4.2 Two-Sample and Three-Sample Tests
5: t-Test
5.1 Student’s t-Test Background
5.2 Example t-Tests
5.3 Case Study
5.4 Excel Tutorial
5.5 Paired t-Test SPSS Tutorial
5.6 Independent t-Test SPSS Tutorial
5.7 Numbers Tutorial
5.8 R Independent/Paired-Samples t-Test Tutorial
6: ANOVA
6.1 ANOVA Background
6.2 Case Study
6.3 One-Way ANOVA Excel Tutorial
6.4 One-Way ANOVA SPSS Tutorial
6.5 One-Way Repeated Measures ANOVA SPSS TUTORIAL
6.6 Two-Way Repeated Measures ANOVA SPSS Tutorial
6.7 One-Way ANOVA Numbers Tutorial
6.8 One-Way R Tutorial
6.9 Two-Way ANOVA R Tutorial
7: Mann–Whitney U and Wilcoxon Signed-Rank
7.1 Mann–Whitney U and Wilcoxon Signed-Rank Background
7.2 Assumptions
7.3 Case Study – Mann—Whitney U Test
7.4 Case Study – Wilcoxon Signed-Rank
7.5 Mann–Whitney U Excel Tutorial
7.6 Wilcoxon Signed-Rank Excel Tutorial
7.7 Mann–Whitney U SPSS Tutorial
7.8 Wilcoxon Signed-Rank SPSS Tutorial
7.9 Mann–Whitney U Numbers Tutorial
7.10 Wilcoxon Signed-Rank Numbers Tutorial
7.11 Mann–Whitney U/Wilcoxon Signed-Rank R Tutorial
8: Kruskal–Wallis
8.1 Kruskal–Wallis Background
8.2 Case Study 1
8.3 Case Study 2
8.4 Kruskal–Wallis Excel Tutorial
8.5 Kruskal–Wallis SPSS Tutorial
8.6 Kruskal–Wallis Numbers Tutorial
8.7 Kruskal–Wallis R Tutorial
9: Chi-Square Test
9.1 Chi-Square Background
9.2 Case Study 1
9.3 Case Study 2
9.4 Chi-Square Excel Tutorial
9.5 Chi-Square SPSS Tutorial
9.6 Chi-Square Numbers Tutorial
9.7 Chi-Square R Tutorial
10: Pearson’s and Spearman’s Correlation
10.1 Correlation Background
10.2 Example
10.3 Case Study – Pearson’s Correlation
10.4 Case Study – Spearman’s Correlation
10.5 Pearson’s Correlation Excel and Numbers Tutorial
10.6 Spearman’s Correlation Excel Tutorial
10.7 Pearson/Spearman’s Correlation SPSS Tutorial
10.8 Pearson/Spearman’s Correlation R Tutorial
11: Linear Regression
11.1 Linear Regression Background
11.2 Case Study
11.3 Linear Regression Excel Tutorial
11.4 Linear Regression SPSS Tutorial
11.5 Linear Regression Numbers Tutorial
11.6 Linear Regression R Tutorial
12: Basics in Excel
12.1 Opening Excel
12.2 Installing the Data Analysis ToolPak
12.3 Cells and Referencing
12.4 Common Commands and Formulas
12.5 Applying Commands to Entire Columns
12.6 Inserting a Function
12.7 Formatting Cells
13: Basics in SPSS
13.1 Opening SPSS
13.2 Labeling Variables
13.3 Setting Decimal Placement
13.4 Determining the Measure of a Variable
13.5 Saving SPSS Data Files
13.6 Saving SPSS Output
14: Basics in Numbers
14.1 Opening Numbers
14.2 Common Commands
14.3 Applying Commands
14.4 Adding Functions
15: Basics in R
15.1 Opening R
15.2 Getting Acquainted with the Console
15.3 Loading Data
15.4 Installing and Loading Packages
15.5 Troubleshooting
16: Appendix
Flow Chart
Literature Cited
Glossary
Index
EULA
People also search:
an introduction to statistical analysis in research, optimized edition
pdf an introduction to statistical analysis in research, optimized edition
free pdf for an introduction to statistical analysis in research, optimized edition
an introduction to statistical analysis in research, optimized edition download pdf free
an introduction to statistical analysis in research, optimized edition scribd
You may also like…
Earth Sciences - Meteorology, Climatology
Medicine - Health-Related Professions


